

Vehicular Health Monitoring Digital Twin PoC
ICANIO built an AI-powered healthcare record digitization platform that cut manual data entry by 60% and improved patient record accessibility 4x.
SRE MONITORING . OBSERVABILITY STACK . INCIDENT RESPONSE
Icanio built an infrastructure monitoring platform to give an enterprise partner centralized, real-time visibility across a sprawling, fragmented cloud environment.
An infrastructure monitoring platform is a unified observability stack that replaces fragmented, manual monitoring with centralized dashboards, automated alerting, and historical data for capacity planning across cloud and on-premise assets. ICANIO built this infrastructure monitoring platform combining Prometheus, Grafana, Alertmanager, Node Exporter, and Blackbox monitoring, achieving 99.9% system uptime and an 80% reduction in Mean Time to Recovery for an enterprise partner.
Manual, fragmented monitoring might work for a small environment, but it becomes a genuine liability once an enterprise is running a sprawling cloud environment that depends on catching failures before customers do. ICANIO’s partner was facing exactly that gap: no centralized dashboard for real-time infrastructure health, delayed response to critical system failures due to manual monitoring, difficulty tracking performance bottlenecks across distributed services, and fragmented alerting systems causing notification fatigue and missed errors.
ICANIO addressed this by architecting an infrastructure monitoring platform rather than patching individual monitoring tools. The objective was to deploy Prometheus for high-dimensional data collection, design Grafana dashboards for 360-degree visibility, integrate Alertmanager for automated Slack and email notifications, and extend coverage with Node Exporter and Blackbox monitoring for hardware, OS-level, and endpoint metrics, backed by automated log aggregation for faster root cause analysis. The result was 99.9% system uptime and an 80% reduction in Mean Time to Recovery.
Every one of those outcomes traces back to the same design decision: consolidating every layer of observability, metrics, dashboards, alerting, and logs, into one platform instead of leaving teams to stitch together fragmented tools during an active incident.
“A blind spot in infrastructure monitoring is not neutral, it is a guarantee that the next incident will be discovered by a customer before it is discovered by the team.”
Our partner faced significant operational risks due to a lack of centralized visibility into their sprawling cloud environment. Fragmented monitoring led to delayed incident responses and system instability.
The absence of centralized SRE dashboards for real-time infrastructure health left the team piecing together status from multiple disconnected tools.
Delayed response to critical system failures due to manual monitoring meant incidents often ran longer than they needed to before anyone noticed.
Difficulty in tracking performance bottlenecks across distributed services made it hard to know which component was actually responsible for degraded performance.
The lack of historical data for capacity planning and trend analysis added high operational overhead every time the team needed to investigate a root cause.
Fragmented alerting systems led to notification fatigue and missed errors, since alerts arrived from too many uncoordinated sources to act on reliably.
Icanio Technologies architected a Unified SRE Monitoring Framework leveraging industry-standard observability tools to automate incident detection and performance tracking. The solutions included:
01
Deployed Prometheus for high-dimensional data collection and querying, giving the platform a reliable metrics foundation across every service.
02
Designed intuitive Grafana dashboards for 360-degree infrastructure visibility, replacing the disconnected views that used to obscure system health.
03
Integrated Alertmanager for automated incident alerting via Slack and email, replacing fragmented alerting with one coordinated notification path.
04
Implemented Node Exporter for granular hardware and OS-level metrics, extending visibility below the application layer.
05
Established Blackbox monitoring to track endpoint availability and latency, catching failures from the outside in, the way a real user would experience them.
06
Configured automated log aggregation for faster root cause analysis, giving the team the historical context needed to diagnose incidents quickly.
This infrastructure monitoring platform delivered outcomes across every dimension of the client’s original observability gap, converting a fragmented, reactive monitoring setup into a proactive platform that catches issues early and recovers from them fast.
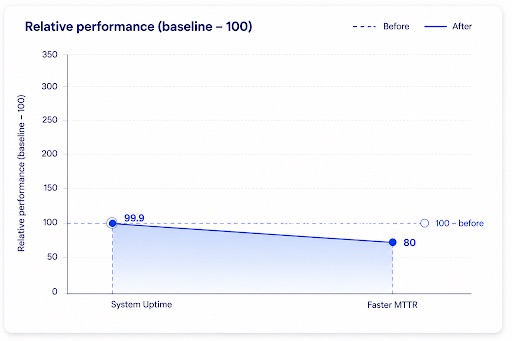
Performance improved through ICANIO’s AI-driven optimization, delivering measurable operational gains while maintaining financial accuracy.
Achieved through proactive monitoring and early incident detection
Mean Time To Recovery via automated real-time alerting
Via an enhanced buyer journey building customer confidence
Eliminating the need for manual 24/7 infrastructure supervision
Through data-driven capacity planning and bottleneck identification
Allowing engineering teams to focus on innovation over fire-fighting
01
99.9% uptime and an 80% faster Mean Time to Recovery are not two separate wins, they came from the same consolidated observability stack. Once Prometheus, Grafana, and Alertmanager fed the same platform, both catching issues early and recovering from them fast became achievable together.
02
Hardware and OS-level metrics from Node Exporter tell you how a system is doing internally, but Blackbox monitoring tells you how it looks from the outside, the perspective that actually matters to users. Combining both is what closed the remaining blind spots this infrastructure monitoring platform eliminated.
03
Without automated log aggregation and historical metrics, every incident investigation started from zero. Building that history into the platform from day one is what let the team move from reactive fire-fighting to a repeatable root cause analysis process.
Fragmented, manual monitoring might have been tolerable for a small, simple environment, but for an enterprise running a sprawling cloud infrastructure, it had become a direct threat to uptime and incident response. This engagement demonstrates that a single infrastructure monitoring platform can resolve visibility, alerting, and recovery-time gaps within one structured programme rather than three separate initiatives.
By combining Prometheus, Grafana, Alertmanager, Node Exporter, and Blackbox monitoring into one observability stack backed by automated log aggregation, ICANIO helped this partner achieve 99.9% system uptime and an 80% reduction in Mean Time to Recovery. The centralized dashboards, automated alerting, and historical data delivered through this engagement are the foundation every future incident this SRE team responds to will run on.
An infrastructure monitoring platform is a unified observability stack that replaces fragmented, manual monitoring with centralized dashboards and automated alerting. An enterprise needs one because a sprawling cloud environment cannot be reliably monitored through disconnected, ad hoc tools.
Prometheus collects and queries high-dimensional time-series data across every service, giving the platform a reliable, queryable foundation for the Grafana dashboards and Alertmanager rules built on top of it.
Node Exporter reports hardware and OS-level metrics from inside each system, while Blackbox monitoring checks endpoint availability and latency from the outside, the same way a real user would experience it. Together they close blind spots that either approach alone would miss.
Alertmanager routes real-time notifications to Slack and email based on defined thresholds the moment an issue is detected, replacing the fragmented alerting that used to delay awareness and, in turn, recovery.
Automated log aggregation gives the team the historical context needed to trace an incident back to its actual cause quickly, rather than manually searching through logs scattered across different systems.
Historical data collected through Prometheus and visualized in Grafana gives the team the trend analysis needed for data-driven capacity planning, turning the platform into a proactive planning tool, not just a reactive alerting system.
From bold ideas to breakthrough execution – our case studies showcase how we transform business challenges into innovation-led success stories.
ICANIO built an AI-powered healthcare record digitization platform that cut manual data entry by 60% and improved patient record accessibility 4x.
ICANIO built an AI-powered healthcare record digitization platform that cut manual data entry by 60% and improved patient record accessibility 4x.

ICANIO built a digital healthcare platform integrating patient records, telemedicine, EHR, billing, wearables, and AI insights, reducing administrative workload by 40% and improvin

ICANIO built a healthcare backend engineering platform that delivered services 2x faster, reduced operational risk by 30%, and improved scalability, reliability, and integration.
ICANIO built an AI-powered healthcare record digitization platform that cut manual data entry by 60% and improved patient record accessibility 4x.

ICANIO built a multi-tenant LLM fine-tuning pipeline on Azure OpenAI with isolated client models, automated DeepEval quality gates, MLflow tracking, and complete training lineage.
Quick Links
Careers
Internship
Contact Sales
© 2025
Icanio - All rights reserved.
