05 Mar 2026

Building Production-Ready Systems: Logging and Metrics Strategy

Building software that works on your local machine is one thing. Building software that works reliably in production, under real traffic and real failures, is a completely different challenge.

Many systems fail not because of bad business logic, but because teams lack visibility into what the system is doing when something goes wrong. This is where logging and metrics play a crucial role.

In this article, we’ll explore how logging and metrics help you build production-ready systems, and how to use them effectively without overcomplicating things.

What Does “Production-Ready” Mean?

A production-ready system is one that:

  • Can be monitored easily
  • Can be debugged quickly
  • Fails gracefully
  • Scales without losing visibility

Logging and metrics are the foundation of all these qualities.

Logging: Understanding What Happened

Logs help answer the question:
“What exactly happened in the system?”

They act as the system’s history, allowing developers to trace issues, debug failures, and understand behavior over time.

Best Practices for Logging

  • Use meaningful log messages
  • Log important events, not everything
  • Include context like request IDs or user IDs
  • Avoid logging sensitive information

Best Practices for Logging

  • Use meaningful log messages
  • Log important events, not everything
  • Include context like request IDs or user IDs
  • Avoid logging sensitive information

Log Levels Matter

Using proper log levels keeps your logs useful and readable.

Common log levels:

  • INFO — Normal application flow
  • WARN — Something unexpected but recoverable
  • ERROR — A failure that needs attention
  • DEBUG — Detailed info for development

If everything is logged as ERROR, finding real issues becomes difficult.

Structured Logging for Production

Production systems should use structured logs (JSON or key-value format).

Benefits:

  • Easy to search and filter
  • Works well with tools like ELK, Splunk, or Loki
  • Scales better than plain text logs

Structured logs turn logs into data — not just text.

Metrics: Measuring System Health

While logs explain what happened, metrics show how the system is behaving over time.

The Four Golden Metrics

  1. Latency — How fast requests are processed
  2. Traffic — Number of requests
  3. Errors — Failure rate
  4. Saturation — Resource usage (CPU, memory, DB connections)

Tracking these gives a clear picture of system health.

Common Metrics to Track (With Use Cases)

Application Metrics

  • Request count per API
  • Success vs failure rate
  • Response time (p50, p95, p99)

Use case:
Detect slow APIs after a new release

Infrastructure Metrics

  • CPU and memory usage
  • Disk I/O
  • Pod/container restarts

Use case:
Identify resource bottlenecks or memory leaks

Database Metrics

  • Query latency
  • Connection pool usage
  • Slow queries

Use case:

Find performance issues caused by inefficient queries

Metrics Should Be Actionable

Good metrics help you take action, not just observe.

❌ “CPU usage is 70%.”
✅ “API latency p99 > 2s for 5 minutes”

Metrics should clearly indicate:

  • What is wrong
  • Where it is happening
  • When action is required

Logs vs Metrics

Logs capture detailed events and are mainly used for debugging with high data volume, explaining what happened, whereas metrics use aggregated data for monitoring with low volume, showing how often it happens.

They serve different purposes but work best together.

Combining Logs and Metrics

A strong observability strategy uses both.

Example:

  • Metrics show error rate increasing
  • Logs reveal which API, request, or user caused the issue

This combination reduces incident resolution time dramatically.

Common Mistakes to Avoid

  • Logging too much or too little
  • Missing correlation IDs
  • Having metrics without alerts
  • Ignoring dashboards until incidents happen

Observability should be proactive, not reactive.

Final Thoughts

Logging and metrics are not optional features — they are core components of production-ready systems.

Good observability:

  • Reduces downtime
  • Improves debugging
  • Builds confidence in deployments

Start simple, stay consistent, and treat logging and metrics as first-class citizens in your system design.

Because in production, visibility is everything.

Related Case Studies

From bold ideas to breakthrough execution — our case studies showcase how we transform business challenges into innovation-led success stories.

Icanio developed a centralized Church CRM platform to streamline member management, event coordination, staff oversight, and pastoral administration with dashboards, attendance tra

Icanio developed Ranger Fusion and Shengel to digitize corporate and industrial operations, streamlining HR, payroll, workforce tracking, and site management through mobile apps wi

Icanio built a SaaS Internal Employee Portal centralizing HR, Finance, and Project operations, streamlining onboarding, training, evaluations, and providing real-time dashboards to

Content shouldn’t slow your website down. Automate updates, events, and layouts with a flexible content platform that empowers teams to publish faster and manage digital experien

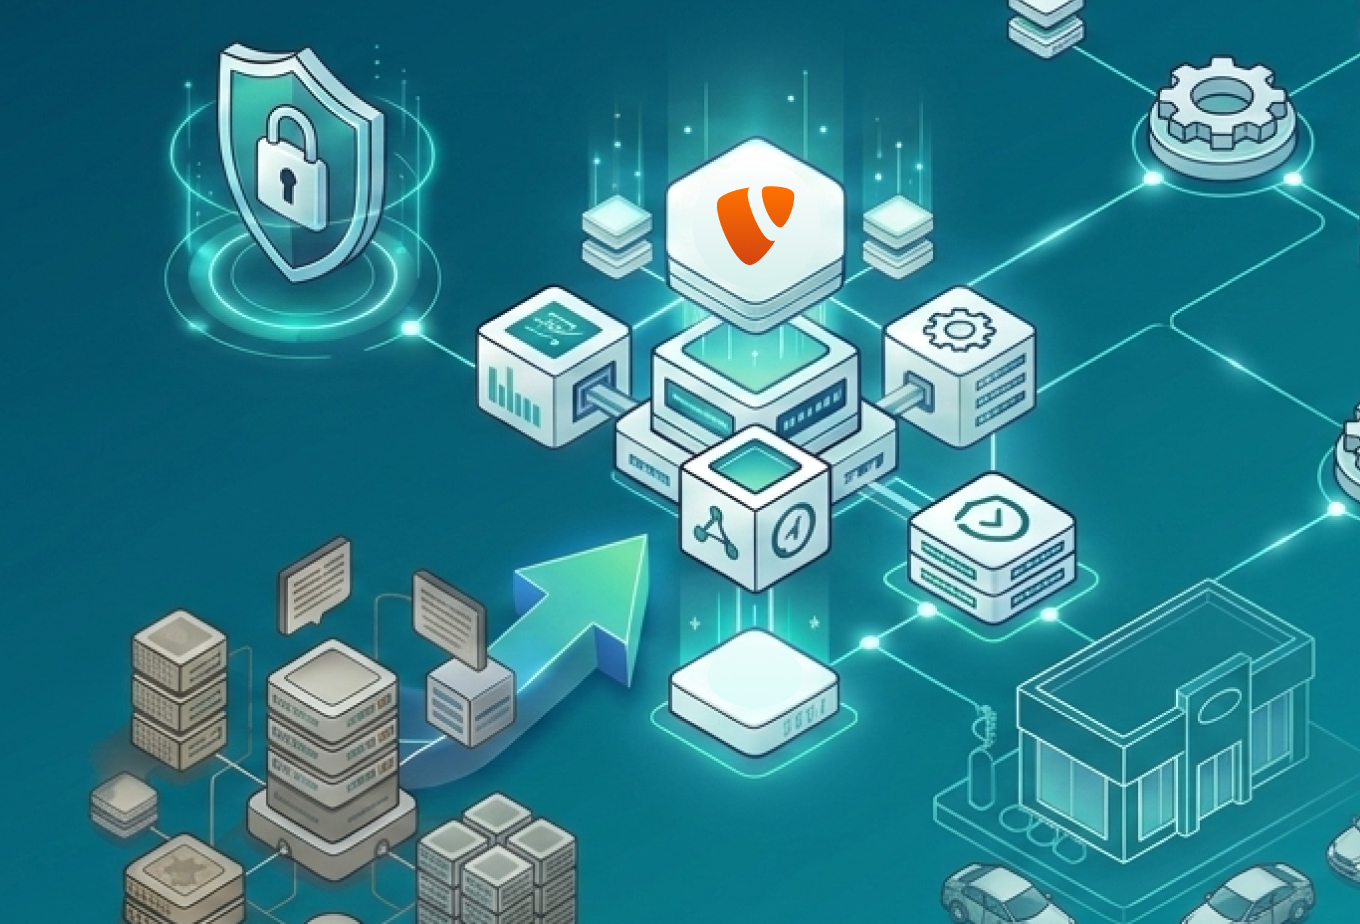
From legacy limitations to cloud-native performance—this TYPO3 evolution delivers automated CI/CD, enterprise security, and mobile-first design to power scalable digital experien

Manage properties smarter with a cloud-native platform that automates rent collection, maintenance tracking, and financial reporting—giving managers real-time visibility across e

Explore Related Services

What would your business look like with a platform built exactly around your workflows?
Explore our Application Development services for scalable digital products.